Monday, 27 June 2022

Ecological Cost of Water


Source: https://www.newyorker.com/tech/annals-of-technology/where-the-water-goes

Water is the primary resource that supports a country's socioeconomic development. The exploitation and utilization of water resources have promoted national economic development but have seriously endangered the sustainability of water resources. Some of the major water-related issues are as follows:

  • Water overuse

  • Water pollution

  • Water stress due to urbanization

  • Unsustainable practices

  • Lack of efficient management

  • Climate change

Causes of Overexploitation of water


  • Failure to implement water resource policies

  • Lack of awareness among customers

  • Incentives favor economic growth over environmental conservation (GDP)

  • Lack of social responsibility among companies

What are Ecological Costs?

Eco-costs are a measure to express the amount of environmental burden of a product on the basis of prevention of that burden. The costs which should be made to reduce the environmental pollution and materials depletion to a level that is in line with the carrying capacity of our earth.

What is Environmental Accounting?

Environmental Accounting is the process of recording, analyzing, and reporting financial and ecological effects on corporate organizations to address environmental issues. Using accounting information systems, recognized as management control systems, could integrate accounting, statistics, environment, and economic development to maximize water resource utilization. A financial information system built on social responsibility accounting could strengthen enterprises’ social responsibilities for environmental protection.

Direct ecological costs

  1. Assessment costs for baseline studies, environmental impact analysis and the preparation of Environmental Impact Assessment (EIA) studies.

  2. Prevention costs incurred in operations that prevent environmental impacts.

  3. Mitigation costs for both new and existing facilities or activities, like control of emissions, effluents and discharges.

  4. Reclamation costs for returning the site of activity and surrounding affected areas to a state “agreed on”.

  5. Compensation costs to affected parties for irrecoverable damage to the environment.

Indirect ecological costs

Indirect costs include the depletion of natural resources, environmental components on water, soil, and habitat; and conservation and efficiency of resource utilization. External environmental costs are those that cannot be accurately measured in monetary terms and assumed by enterprises.

What is the ROI?


  • An effective environmental cost accounting of water resources could solve the problems of water quality deterioration and water environment destruction.

  • Enabled companies and their partners in the supply chain to gain significant cost savings from environmental considerations.

  • Reduce their operating costs, better price the products as well as save natural resources.

  • Implementing eco-efficiency indicators has assisted them to use more efficient energy and resources in developing their products.

  • EMA is associated with innovation and cleaner production. Thus, it leads to increased shareholder value and improved firm reputation.


EMA Tools

Some available techniques of EMA can be employed to meet the specific need of entities,

namely costing analysis, investment appraisal and performance management.


The EMA tools include: 

  • Life Cycle Assessment  (LCA), 

  • Activity-Based Costing (ABC), and

  • Material Flow Accounting,  

  • Total Cost Assessment  (TCA), and

  • Environmental  Balance Scorecard (EBS) or 

  • Sustainability Balance Scorecard (SBSC).


In terms of Water

In terms of water, direct costs include the price of water, operational costs and investments in water infrastructureThe second is indirect costs like environmental fines, insurance premiums, and legal and corporate social responsibility costs

Finally, there are costs related to risks, which could include the financial consequences of water shortages, flooding, financial such as credit ratings and regulatory risks, and even reputational risks.


Defects in the Water Supply Infrastructure

The direct costs of water depend on the networked water supply infrastructure including factors like the source of water, transport distance to the treatment plant, treatment process, transportation to the city and distribution channels. These also include operation, maintenance costs, and sinking funds. Indirect costs would also include water lost due to leakages in pipes or tankers.

Issues with respect to water management in cities:

  • Monopoly of the water sector, rural areas tend to receive less water

  • Poor communication among the different departments within water supply organizations like BWSSB

  • Water is expensive and inaccessible to the poor

  • Lack of regulators and monitoring of tariffs


In peri-urban areas of Bangalore, farmers are aware that their lands would be taken over by municipal corporations. They grow cash crops and sell wood, used for scaffolding in houses. Borewells on these lands extract water and supply it to the city via tankers. Hence, depleting the ecological value of the land completely. 


Again, there is no sense of responsibility regarding water management and the importance is given to the economic value of the land.


Rainbow Drive Layout


The Rainbow Drive layout is a private gated residential 34-acre-layout. On all the built-up plots, a total of 258 households are residing and around 90 households are tenants. The layout did not have any formal water supply from the Bengaluru’s water utility, the BWSSB and completely depended on its borewells as a water source.


The Plot Owners’ Association took various measures to tackle water problems:

  • Ban of digging private borewells and residents depend on community borewells alone 

  • The POA invested in community recharge wells, integrated with storm water drains. (3 feet in diameter and 20 feet in depth)

  • Efforts were made to undertake an outreach and engagement program to the wider resident community of Rainbow Drive about the benefits of rainwater harvesting.

  • The residents were given the option to have household recharge wells or sponsor a recharge well in the community. They provided a discount of Rs 100 to the people who have done household RWH system.

  • To reduce water wastage, consumption meters for each household and a tariff of Rs 6/ KL were introduced in 2006. Later, it was found that the water tariff only accounted for the electricity used to pump borewell water. It did not account for the maintenance costs of bore wells, or the costs of cleaning the water tanks, waterproofing leaks, or fixes to faulty piping. Most importantly, it was found that the cost of treating sewage was not accounted for in the household water bill at all. The true production cost of water was determined to be Rs. 25 per kilolitre.

  • In 2015, they employed NEERI’s Phytorid Technology to treat wastewater. The technique uses anaerobic digestion, followed by a root zone treatment.

    Source: http://bengaluru.urbanwaters.in/wp-content/uploads/sites/3/2018/10/Biome-GSI-Paper-Citizens-demonstrate-water-management-solutions-for-the-city-2.pdf


Benefits achieved :
  • The groundwater table has risen to 250 ft and recharge wells have been able to reduce flooding during monsoons. 

  • The freshwater demand per house has reduced significantly. From 280 to 150 LPCD

  • Using the Phytorid technology has reduced the energy cost of treating water. It has achieved a savings of Rs 80,000/- per month on operations costs. 

  • The total estimated recharge of the layout now exceeds the groundwater withdrawn from its borewell. Two borewells provide 1.3 lakh liters of water every day. 80 KL of water is treated at the STP and reused within the community.


Solutions for the City Level


  • A decentralized strategy

  • Citizens should demand management through education and appropriate tariffs on water, rainwater harvesting and groundwater recharge for flood control and groundwater sustainability, and, wastewater treatment and reuse to reduce freshwater demand and ensure responsible discharge of wastewater.

  • Retail meters in every legal connection to monitor water consumption and collect tariffs accurately. So, if consumes more water he should pay through and increase the block tariff.

  • The cost of treating wastewater should also be taken into the account according to the polluter pays principle.

  • A constant flow of information and a dialogue with the politicians and citizens of the city would help everybody understand what the future holds for them in a water-constrained city.


Wastewater- Lakes in the Kolar district

Treated water from Bangalore flowing into a lake in Kolar
More than 300 million liters per day of a targeted 440 MLD is being transferred from Bengaluru to the adjoining, parched district of Kolar and parts of Chikkaballapur through the Koramangala-Challaghatta Valley project. This water is then pushed into 126 lakes scattered around Kolar, many of them left dry by successive droughts. The purpose of the project is to rejuvenate the depleted groundwater in the drought-hit Kolar region.


Investments/ Costs

  • De-silting of the lake and feeder channels

  • Maintenance of wells and bunds, sluice gates, etc

  • Tree planting in the catchment area

  • Impact of the Quarry in the catchment


Benefits 

  • An increase in the water levels in the wells

  • Amount of crops grown

  • Cash crops

  • Fishing


By Sneham Pandey and Prajwal Chendkapure


Urbanisation and Lakes of Bengaluru

Bengaluru is India's fifth-largest urban centre, with a population of 8.5 million people (census 2011). Within a 0.64 per cent land share, Bengaluru is a place of residence for 14.64 per cent of the state's population. The population of the city increased at the highest rate in urban India—42 per cent—between 2001 and 2011. The decadal population of Bengaluru is depicted in this Figure 1. Moreover, it is distinguished by a radial system made up of the axes that converge in the city's centre. Figure 2 depicts Bengaluru's spatial expansion between 1973 and 2010 which shows how significantly the spatial distribution of built-up areas and vegetation has altered since that time. 


Bengaluru is appropriately referred to as "The Garden City of India" and "The City of Lakes" due to its diverse biological resources. Here, forests make up 4% of land use (16.89 sq km), lakes make up 9.25% of land use (36.45 sq km), and parks make up 7.5% of land usage (30. 24 sq. km). The majority is made up of lakes, which is why there are both quantitatively and qualitatively significant for a detailed analysis.

The diverse landform undulations in Bengaluru's radial drainage system assist water flow from the plateau's top to the base. The population heavily relied on rains and groundwater because there were no other close perennial supplies of water. To meet a sizable portion of their water needs, they dug out lakes and tanks in these depressions. Bengaluru is divided into five primary catchments (Hebbal, Bellandur, Vrushabahavthi, Arkabhavati and the other one) by the main North-South ridge and the cross East-West ridge, and these lakes were connected when they were carved out in response to the flow of water.

The Present Situation of the Lakes

A team of researchers from the IISc Bangalore led by Professor Ramachandra recently did a study on lakes titled "Wetlands: Treasures of Bangalore (Abused, Polluted, Encroached and Vanishing)" that examined 105 lakes in the area. Only four lakes seemed to be in a good condition, but 25 lakes were discovered to be in very bad condition, completely covered with macrophytes or dumped with solid or liquid wastes, with little to no water.
It was found that 90% of the lakes were sewage-fed due to sustained flow of untreated sewage and industrial effluents, dumping of solid wastes and building debris. Even the water quality analysis of 80 lakes found that almost half of the lakes were highly polluted and none of the lakes had water that was fit for drinking according to standards set by the Central Pollution Control Board. The lakes in the Koramangala-Challaghatta valleys were the most polluted as compared to those in the Hebbal, Vrushabahavthi valley. Also, fish deaths were reported in Sankey, Lalbagh, Jakkur and Munnekolala lakes. Whereas, foam formation was seen in lakes such as Bellandur, Rampura, Varthur etc.

Professor Ramachandra argues, "It is so sad that there are so many resources put in to change the situation, but there is no initiative and interest from the bureaucracy to make a real difference. In this study, the researchers have found that four lakes were better off than many others and why did this happen? This was only because they were restored and taken care of by residents." If local people, non-government organisations, bureaucrats, and regulators, come together and decide to bring about a difference with utmost sincerity, the situation will change, because the right to live with clean water and the environment is for everyone, not only the influential.
A few main reasons for this state of the wetlands could be a lack of sense of belonging among all the stakeholders; sincerity and poor decision-making from the bureaucracy; poor implementation of regulatory norms and governance; lack of coordination between the many para-state agencies who were custodians of the lakes leading to their poor maintenance.

Impact of Vanished and Encroached Lakes

A few of the impacts of urbanisation that we can notice on lakes can be broadly categorised as a change in the governance of lakes, change in resource use and the impact on the lake ecosystem. Here is the detailed list of visible changes on lakes that we saw:

  • The decline in the number of lakes: It is a well-known fact that several lakes in the city have disappeared as a result of rapid urbanisation. Moreover, several studies have been conducted that point toward rapid urbanisation as the prime reason for the loss of wetlands.

  • Loss of irrigated, watershed and catchment areas: The immediate impact of the disappearance and deterioration of lakes is the loss of irrigated areas. As per the latest data, there are around 36,000 tanks in the state with a command area of approx 7 lakh hectares, which works out to 18.82 ha of irrigated area per tank and an average water-spread area of 11 ha. If we go by this norm, the disappearance of 195 tanks in Bangalore caused the loss of irrigated area of about 2540 ha.

  • Human suffering and health hazards: The loss of irrigated areas and the resultant decline in production are directly related to the conversion of lakes into non-agricultural purposes. Moreover, the contaminated water of these lakes is also causing many diseases such as Jaundice, Cholera, and other serious health hazards in the immediate environs. The percolation of this water into the ground has caused a high nitrate presence in the groundwater.

  • Loss of drinking water sources: Today, the city of Bangalore is getting water from Cauvery which is 140 km away at an enormous price. According to BWSSB, the total cost of producing and supplying 2,47,382 million litres of water during 2001 was Rs 5722 million, which worked out to Rs 23.13 per litre as against Rs 5.98 in 1991. This cost per litre is exorbitant when compared to many metros in the country. Much of this has been accounted for in power cost. It is stated that the power bill comes to about Rs 21 crore per month. Moreover, the recharging capacity of lakes has also been reduced due to non-filling and loss of water-spread area and storage. This situation has forced the civic bodies to shift from tank sources to alternative sources for supplementing drinking water, though at a high cost.

  • Reduction of storage due to encroachment and sedimentation: The lakes have become dumping grounds for all kinds of waste materials which has led to water pollution and silt formation in the lakes affecting the water-holding capacity of water bodies. Even, the sedimentation has also reduced the water impounding capacity of the lakes.

  • Pollution of water and groundwater: High concentration of metals in the grown vegetables using polluted lake water. The pollution of lakes due to sewage, sludge and industrial effluents is a common phenomenon in urban areas. Ultimately these led to the crops growing.

  • Impact on Flora and Fauna: A variety of rich fauna and flora around the lakes have contributed to the salubrious climate in the city. But, the loss of lakes and water-spread areas has affected the flora and fauna of the tanks in a significant way. The flora such as typha, Lily, etc. is rarely to be seen at present.

  • Flooding of Urban Areas: The average height of Bangalore in terms of topography is 850 to 930 meters. Water flows from these heights and is harvested by a chain of tanks and has a hierarchical system to arrest rainwater in such a way that the overflow of one tank reaches into the other tank downstream without flooding and causing loss of property and life. Despite this system, devastating floods occur in the city damaging property and endangering life.


Hence, keeping in the mind the adverse situation of lakes in Bengaluru, adopting a holistic and integrated approach to conserving and managing lakes through a bottom-up approach could be a way out.

Written By: Srishty Pandey (Group 1)


Necessity of RO

Background

Less than 50 percent of the population in India has access to safely managed drinking water. Chemical contamination of water, mainly through fluoride and arsenic, is present in 1.96 million dwellings. Excess fluoride in India may be affecting tens of millions of people across 19 states. Worryingly, excess arsenic may affect up to 15 million people in West Bengal.

How it works: OSMOSIS & REVERSE OSMOSIS

  • Osmosis is the movement of any solvent (usually water) from a region of low concentration to a region of high concentration when separated by a semipermeable membrane (which allows movement of the solvent but not the solute).
  • Therefore, it would happen because of some force, this is known as osmotic pressure.
  •  

  • But if there is external pressure, the pressure applied should be enough to overcome the osmotic pressure so as to forcibly remove water to one side of the semi-permeable membrane leaving the solutes on one side.
  • Therefore, we have simply pure water on the other side.
  • This is known as reverse osmosis or RO.
  • The bad side of RO

  • RO technology is not applicable to all water types.
  • Even the Indian water purifier industry admits this.
  • RO cannot be universally applicable for all water types due to key technology limitations.
  • The process of reverse osmosis eliminates only chemical contaminants from the water.
  • The RO process gives a free pass to all biological contaminants i.e. bacteria and viruses in the water.
  • It’s all about the TDS

    RO water purifiers are effective on this count, especially in places where pesticide use contaminates groundwater (states such as Punjab) The Bureau of Indian Standards prescribes TDS of 500 mg/litre as acceptable. On the other end of the spectrum, water with low concentrations of TDS may also be unacceptable because of its flat, insipid taste.


    Bengaluru’s case

    Bengaluru's water was well within the prescribed range even before treatment and increased marginally after treatment. A 2015 study that tested the city's water for pH (acidic-alkaline value) and TDS found that 82.66 percent of the total samples were below the permissible TDS range. "Central region of Bangalore demonstrated 100% potability, east and west regions showed >90% of the same, whereas south-east was poorest of all with 63.88%".

    Water wastage

    For every one litre of potable water, RO water filters push out three to four litres of water, as per broad estimates. This 'reject' water is saline as it has a higher concentration of chemical contaminants. Saline water cannot be used to flush the toilet, swab floors, or wash cars. It will eventually find its way into the ground, contaminating everything along the way. In the long term, this will not only impact groundwater quality, but also soil and agriculture.

    Stories of RO

    Here is a RO Filter at Thoredoddi Government High School


    The Rejected water is being collected in buckets and used for watering plants in the garden


    Here's another picture where RO Rejected Water is used as a water source for the washing machine


    These ideas cannot be implemented everywhere as TDS levels of water differ from place to place.


    The ideal solution would be using a filter to treat the rejected water. Through this, the water can be effectively managed and reused.


    Refer to the presentation for an overview 


    References:


    - Rohith, Shivani, Sadhana


    The bad side of RO :

    O-Mittur lake mapping – Gottakere

                Gottakere lake situated in O-Mittur panchayat, Kolar district was mapped to understand its hydrological and social dynamics. The peak season for the lake is the months of October to November and the lake water is mostly used for agricultural purposes. The downstream lake is Yalagondahalli. The lake has three distribution channels or kaluves where one runs along the western boundary of the lake and the other two flow towards the west along two tree lines as that is the command area of the lake.


    All three channels begin at the outlet of the sluice gate.


    The inlet of the sluice gate had a stone marker near it to measure the depth of water in the lake.


    The main inlet of the lake is situated along its western boundary.


    Another inlet for the lake is the Seetanamakere inlet from an upstream lake. The stormwater drain from the Pichaguntlahalli village is let into the lake. There is a closed inlet towards the northwest direction of the lake.

    The lake has four open wells in its surroundings and four borewells in its command area. None of the wells is in use currently due to the presence of borewells and as the lake has water in it, two wells have solid waste dumpings in them. Well 2 was covered by trees and had a large snake in it. The water from the borewells is used to cultivate Mulberry and flat beans while the lake water was used to cultivate paddy. Agricultural practices in the command area took place in both Rabi and Kharif seasons.


    There were 130 families in the village out of which 80 had land holdings and were involved in farming while 50 households were involved in non-agricultural activities with some being landless labourers. The village had 400 registered voters. Approximately 15 – 20 women are employed in agricultural activities for a duration of 1.5 months in the harvest seasons.

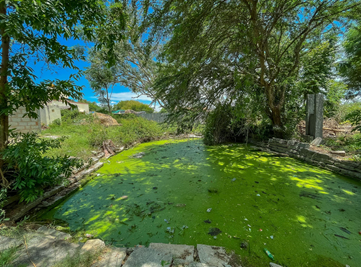
    The waste weir is situated in the southwest direction of the lake, it is currently broken and needs maintenance. There is a small Kalyani in the lake in its southeast part for religious activities. The Kalyani is completely covered by algal species with a clear presence of eutrophication.


                There was no presence of algal growth in the lake. The lake only had blooming pink water lilies in it. Pongamia trees were commonly found around the lake and were used as a part of biomass production. The banks of the lake were infested by Lantana camara. Plantations of Eucalyptus were also observed in the command area of the lake.


    Refer to the presentation for reference

    Date of documentation: 13/06/22

    By: Shivani Ilangovan, Rohith Varma, Sadhana Joshi.