Sunday, 10 March 2019


Pictured is water being pumped out of an aquifer into this holding pit. Water from the pit is pumped into water tankers that sell the water to rural homes and farms for much higher prices than if they were connected to the tap. It felt like we were witnessing the Earth being robbed and sucked dry. But of course, people need to drink water! And it's not as though the water that comes out of our tap in the city is sourced much differently. Water is a shared resource and all of us face water scarcity.

Bonus: There were fish in the holding pit due to a recent storm! (I guess it rains fish?) Just kidding, there was a larger pond nearby that must have overflowed during the storm.

Cristina
Get ready for a story
Henk with the boys :)

A day as a Biome Intern from the University of Washington


Yesterday was our team’s first field visit without a supervisor from either the GCIL team, or Biome (the NGO we are interning with). The day started off at 9:15 am. We borrowed a 3-meter measuring tape from Elbin, and Bujin loaded 8 packages of cookies into her backpack, as usual. Personally, I thought this was too few. I hoped she knew that I planned to eat some of them. 

After about an hour drive, we arrived at Rajiv Nagar primary school. We walked in to interview the headmaster.  Turns out, he was on his way out and wouldn’t be back until 3 pm. It was 10 am. Fortunately, he was graceful enough to allow us to interview him quickly. As soon as we sat down, he asked if we had a permit to take up teachers’ and students’ time. We did not. But luck was on our side once again, and with Anna, our translator’s help, we called Biome, and somehow cleared up the issue. We finished up that interview, and then spoke to the Rainwater Team, a team of 5 or 6 boys who perform basic, easy maintenance on the rainwater harvesting system. The boys exhibited groupthink, with all 5 of them bobbing their heads at whichever question, and all of them standing in a kind of superhero formation, with a leader in the front. I am not sure why, but they rarely smiled. When asked why there were no girls on the team, they said that the girls couldn’t go on the roof because of their skirts, and that the girls were too weak to turn the plastic rainwater switch that opens and closes one of the pipes. When prompting the teachers about the same topic, they told us that there are girls on the rainwater team. We spoke to these young ladies afterwards. It was extremely weird to me that their rolls were hardly acknowledged, even if they are not allowed to do everything the boys do. 

Nonetheless, we moved on to the the second part of our field visit. Henk, Evan, and I went on the roof to measure the area of the rainwater catchment basin. We found two local women looking up at us, and their golden retriever, whom they lifted up so that he was only standing on his back paws, and shook his paw to wave at us. I was sad that I couldn’t better communicate with these two friendly, seemingly awesome women. 

Then, despite all of the ups and downs in our visit, the unthinkable happened. Evan climbed down the ladder from the roof. I climbed down. Henk climbed down. Now, on this side of the building we were climbing up and down from, several trees had been planted. Most of them were a decent size, say 3 to 10 feet. But one small sapling had recently been planted. You could tell it was just beginning to grow, about to hit a growth spurt maybe. But sadly, just as Henk reached the ground, he stepped slightly to the left of the ladder, and in one quick motion, smashed the beautiful sapling almost completely in half. One of the boys watching started muttering under his breathe, probably regretting ever fetching the ladder to allow us on to the roof. He grabbed the closest rocks and tried his best to prop up the pitiful plant. It almost looked good as new, but we all knew the truth. The little sapling could never recover. 

“Ksamisi, ksamisi!*” Cried Henk. He was practically in tears over his betrayal to our guests. Anna translated for us that that sapling was a special plant that this student and the headmaster had planted and taken care of together. Of course. Henk could not keep it in upon hearing this detail, and began to sob. ** 

We comforted Henk, and said we could go buy another sapling. So, we all loaded into the car, with the three students who had witnessed the accident (including the student who helped plant the sapling), and went to the nearby plant nursery. There were beautiful roses and hibiscus plants! They did not have the same type of tree which Henk had just murdered, but the students picked out a different tree, and in addition, Henk bought the headmaster a small rose bush. 

Overall, I’d say our first mission without supervision was a success. 


UW Interns: Cristina, Henk, Evan and Bujin

Saturday, 4 August 2018

Obtaining Rainfall Data From KSNDMC

To obtain the rainfall dataset you want -
  1. Send in an email to office@ksndmc.org addressing the director
  2. In the email, make sure you mention who you are, what data you want, what you intend to do with the data, and whether the purpose is commercial
  3. Call the toll free number +91 080 67355000 if you don’t get an email reply within 3-4 working days. (Note - Do not call on Sundays as the office is closed and call between 10AM-6PM)
  4. On approval from the director, the data would be sent to you in a raw excel sheet format
The datasets I got for my project are -
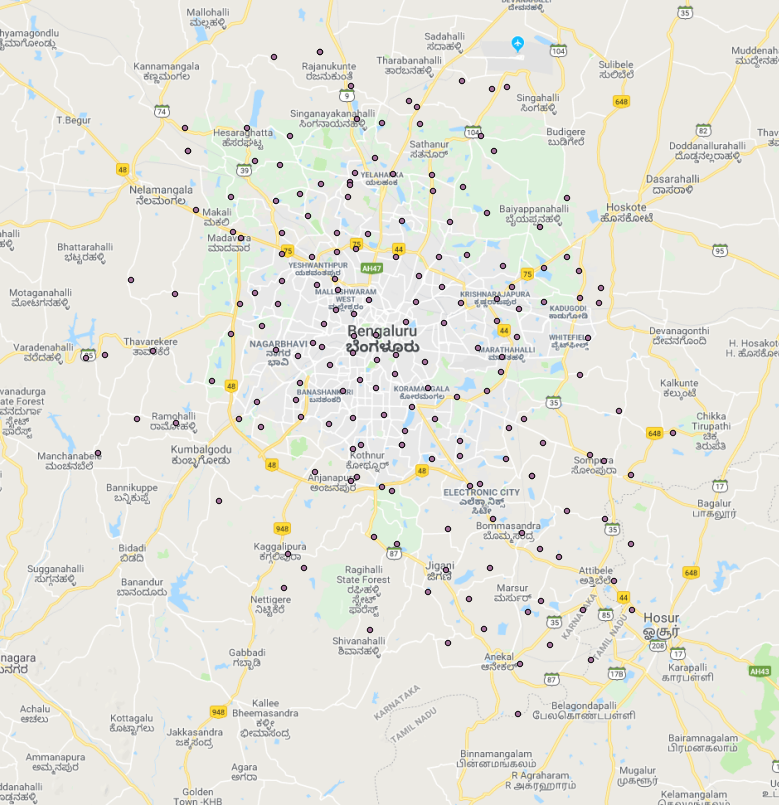
  • Daily rainfall data for 184 rain gauges situated across the Bengaluru Urban district
  • A shapefile containing all rain gauge locations
  • Rainfall data, for the last 30 years, across the 4 taluks (Anekal, North, South, East) in the Bengaluru Urban district
*I decided not to use the third dataset for this task

Data Cleansing -
  • A major problem was the lack of coherence between the hobli names in the shapefile and the hobli names in the excel sheet mostly in terms of spelling and format differences (capitalisation, underscores, etc)
  • This meant that I could not join my required field (in this case, annual rainfall for each rain gauge) to the shapefile directly without making all the record names match - a task which I performed manually across all 184 rain gauges
*PM contact@biome-solutions.com for more information on the cleansed dataset

- Vikhyath Mondreti, Summer Intern at Biome Environmental Solutions

Visualisation of rainfall data across 184 KSNDMC rain gauges (Bengaluru Urban District) over the past 3 years

Here are the maps that visualise the rainfall dataset I received from KSNDMC. The following data pertains to the Bengaluru Urban District only and has been updated till 2017.

Isopluvial Maps

Map of the rain gauge locations (interactive map link below)

2015 (only 181 rain gauges)


2016


2017


Interactive Maps*


Rain Gauge Locations Only


2015


2016


2017


*Notes 


  • The accuracy of my maps completely depends on the accuracy of the data provided to me by KSNDMC
  • The word ‘Year’ in the information boxes in the interactive Rain Gauge Locations Maps refers to the annual rainfall value in millimetres. 
  • My heat maps provide only a fixed sphere of influence (radius) for each rain gauge and therefore, will not prove useful if you zoom in too much. 
  • However, if you want to a more detailed heat map that allows you to zoom into specific regions and still see a colour gradient (trend) then make a copy of my fusion table (through the link provided) and change the ‘radius’ to 50 (or any high value)

- Vikhyath Mondreti, Summer Intern at Biome Environmental Solutions

Effectively Visualising Rainfall Data

There are two methods of data visualisation (for rainfall) I found quite useful while working on my project at Biome: Contour Maps (QGIS) and Interactive feature and heat maps (Google Fusion Tables). This post is a step-by-step tutorial on making both these types of maps.

Creating Contour Maps (Isohyetal Maps) in QGIS

  1. First import the shapefile containing rain gauge locations using the   button. Next, check if you have installed the openlayers plugin in the Plugins>Manage and Install Plugins option and then access the Web>OpenLayers plugin>Google maps>Google Streets option.
  2. If everything worked out correctly, the rain gauge ‘dots’ should be exactly over their location in the labelled google map. You can check this by right clicking on the imported shapefile in the layers panel and selecting the Open Attribute Table option followed by selecting a specific record (rain gauge) in the attribute table to see it highlighted in the google map (dot turns yellow). If the yellow dot’s location in the map matches the location given in the table then the overlay has been successful (ignore the CRS)
  3. Now install a plugin called MMQGIS so that it shows up in the list of menus available. Go to MMQGIS>Combine>Attributes Join from CSV file. Input the CSV file address and select the correct file field to join (the matching name - in this case, the hobli name). Choose a location to save the output shapefile and “Not found” output list. We are using this plugin as it works far more reliably than the default ‘Joins’ feature present in QGIS.
  4. A new layer would now be present with the joined field (in my case, yearly rainfall). However, one problem that exists is that QGIS imports all CSV fields as String data type  (and cannot therefore differentiate Rainfall as an integer value). To solve this issue, go to Processing>Toolbox to open up the toolbox window and then search up ‘Refactor fields’. Using this algorithm, you can change the datatype of the required field. In my case, I changed yearly rainfall to a double data type (with the joined shapefile being the input layer)  and saved the output to another layer.
  5. Finally, this refactored layer can be used to make a raster interpolation. For this, confirm that you have the Raster plugin installed and navigate to the Raster>Interpolation>Interpolation option. Choose the refactored layer as the input file and choose the required attribute you want the contour map to show (in my case, yearly rainfall) and hit Add. Leave all other settings the same and set the output file address before hitting OK.
  6. You now have the raster interpolation which can be used to produce the Contour Map! Navigate to Raster>Extraction>Contour and select the raster image as the input. Give the location of where you want to store the contour lines output and select the contour interval (distance between the lines). My ‘Attribute Name’ was rainfall with the contour interval for ordinary contours set at 10 and index contours (seperate layer) set at 40.
  7. You can turn on labels by right clicking on the index contour layer and selecting the properties followed by the labels option. The style (colours, line thickness, etc) can be altered in the style option.

Creating Interactive Maps in Google Fusion Tables

  1. Go to shpescape.com* and click on the ‘shp 2 fusion tables’ option. On the next page, hit continue and login to your google account (if you already aren’t) and grant access to your Fusion Tables.
  2. Make sure that you have a zipped version of the folder that contains the prj, shp, shx, and dbf files for the specific shapefile layer (in my case, the joined and refactored shapefile made in QGIS) and then upload that zip archive to the website.
  3. Do not select any of the advanced options and click upload. In a few seconds, a link should be produced that takes you to a Fusion Table with your shapefile when clicked.
  4. Go to the map’s tab and choose whether you want a feature map (in my case, rain gauge locations) or a heat map (in my case, weighted for annual rainfall).
  5. For the heatmap you can adjust the radius (radius of influence in pixels) and the opacity of the colours. My map was set to a radius of 31 and an opacity of 60%.
  6. For each type of map, go to Tools>Publish and with the appropriate visibility settings (ex - anyone with the link can see this) share the link under ‘Send a link in email or IM’.
  7. This link offers access to a fully interactive map. For instance, the rain gauges in my feature map can be clicked to reveal their name and yearly rainfall value (mm).
*Please note that the shpescape website is very unreliable and must be refreshed several times (usually at each stage) to get through the entire process successfully

- Vikhyath Mondreti, Summer Intern at Biome Environmental Solutions