Here are the maps that visualise the rainfall dataset I received from KSNDMC. The following data pertains to the Bengaluru Urban District only and has been updated till 2017.
Isopluvial Maps
Map of the rain gauge locations (interactive map link below)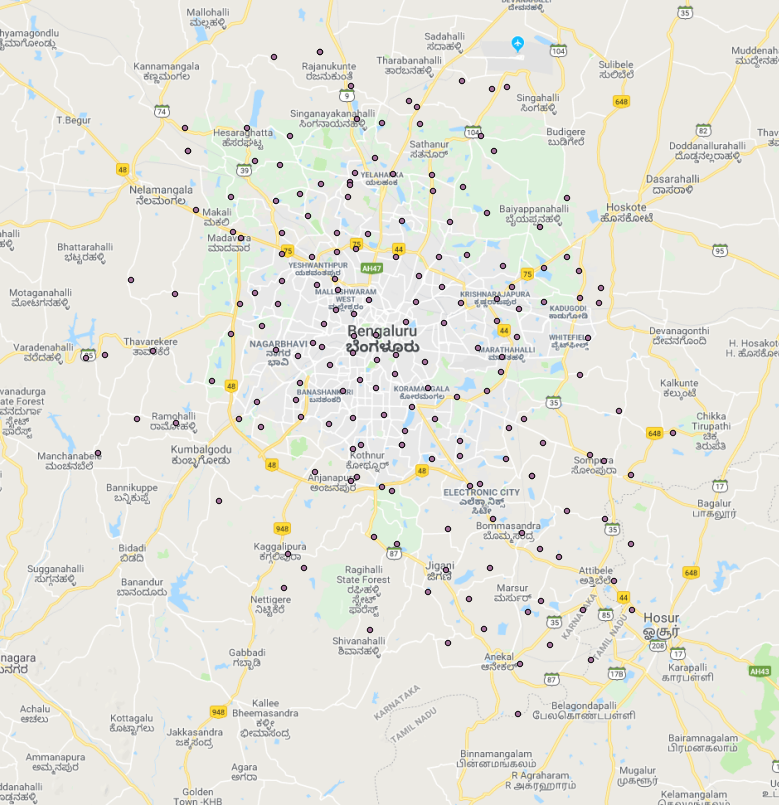
2015 (only 181 rain gauges)

2016

2017

Interactive Maps*
Rain Gauge Locations Only
2015
Rain Gauge Locations - https://fusiontables.google.com/embedviz?q=select+col0+from+1LDM-iDARMQFx9LUz0gY0RBaWr_yv8UeKWoWGaXk0&viz=MAP&h=false&lat=12.934968015788717&lng=77.58448283630003&t=1&z=10&l=col0&y=2&tmplt=2&hml=KML
Fusion Table - https://www.google.com/fusiontables/DataSource?docid=1LDM-iDARMQFx9LUz0gY0RBaWr_yv8UeKWoWGaXk0
2016
Rain Gauge Locations - https://fusiontables.google.com/embedviz?q=select+col0+from+1xGJbDMRq6z_480qcZY0kEuIIiOU63pGxRIthuKj1&viz=MAP&h=false&lat=12.934968015788717&lng=77.58448283630003&t=1&z=10&l=col0&y=2&tmplt=2&hml=KML
Fusion Table - https://www.google.com/fusiontables/DataSource?docid=1xGJbDMRq6z_480qcZY0kEuIIiOU63pGxRIthuKj1
2017
Fusion Table - https://www.google.com/fusiontables/DataSource?docid=1zMxKDrLVkWD3-PcWll5EaOultkmU6vEfpB2sTInu
*Notes
- The accuracy of my maps completely depends on the accuracy of the data provided to me by KSNDMC
- The word ‘Year’ in the information boxes in the interactive Rain Gauge Locations Maps refers to the annual rainfall value in millimetres.
- My heat maps provide only a fixed sphere of influence (radius) for each rain gauge and therefore, will not prove useful if you zoom in too much.
- However, if you want to a more detailed heat map that allows you to zoom into specific regions and still see a colour gradient (trend) then make a copy of my fusion table (through the link provided) and change the ‘radius’ to 50 (or any high value)
- Vikhyath Mondreti, Summer Intern at Biome Environmental Solutions
No comments:
Post a Comment